

Abstract
Recently, data-driven inertial navigation approaches have demonstrated their capability of using well-trained neural networks to obtain accurate position estimates from inertial measurement units (IMU) measurements. In this paper, we propose a novel robust Contextual Transformer-based network for Inertial Navigation~(CTIN) to accurately predict velocity and trajectory. To this end, we first design a ResNet-based encoder enhanced by local and global multi-head self-attention to capture spatial contextual information from IMU measurements. Then we fuse these spatial representations with temporal knowledge by leveraging multi-head attention in the Transformer decoder. Finally, multi-task learning with uncertainty reduction is leveraged to improve learning efficiency and prediction accuracy of velocity and trajectory. Through extensive experiments over a wide range of inertial datasets~(e.g., RIDI, OxIOD, RoNIN, IDOL, and our own), CTIN is very robust and outperforms state-of-the-art models.
System Architecture
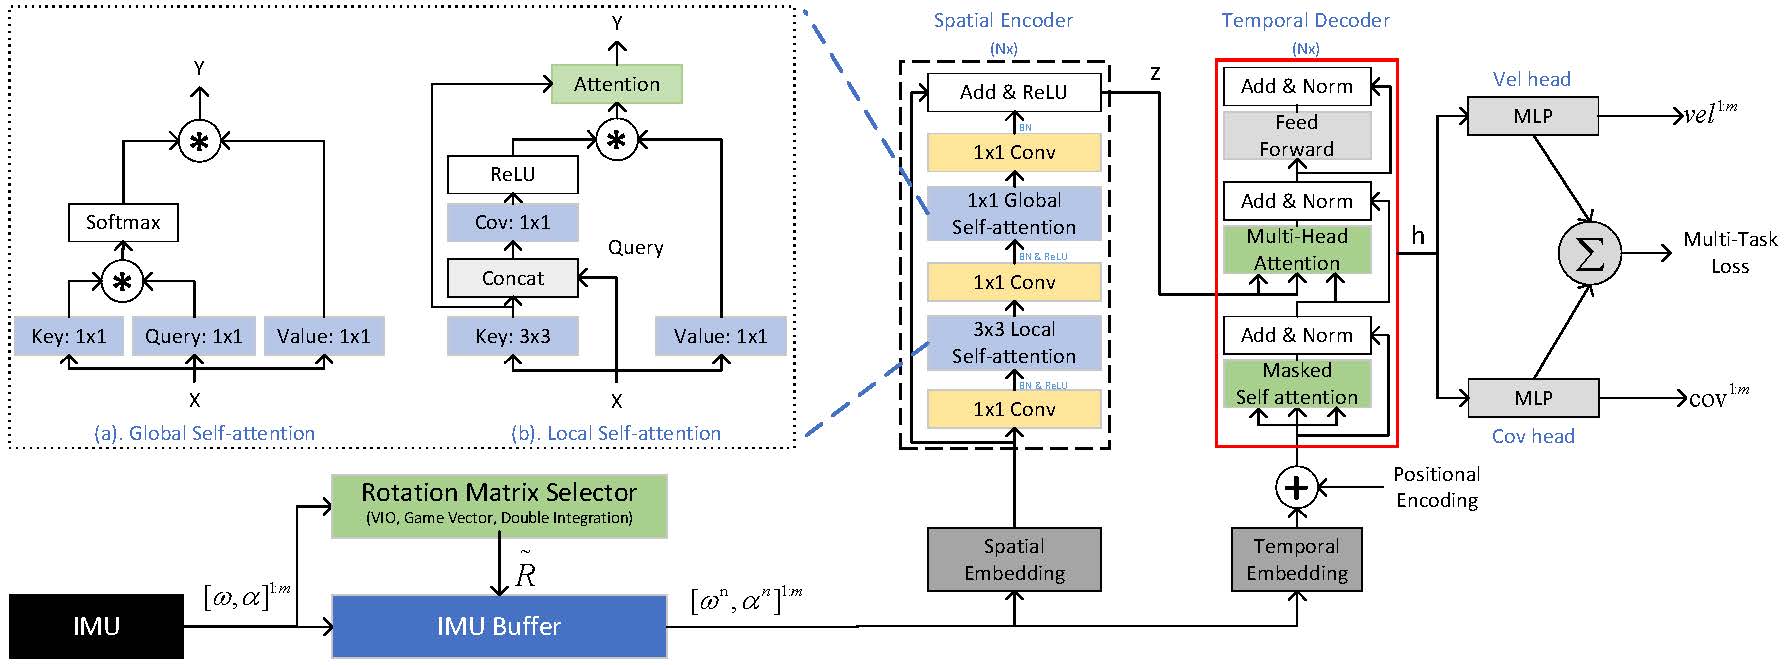
Figure.1 - Overall workflow of the proposed contextual transformer model for inertial navigation.
Experimental Results
we evaluate CTIN on five datasets against four representative prior research works. As shown in Table 1, all selected datasets with rich motion contexts (handheld, pocket, and leg) are collected by multiple subjects using two devices: one is to collect IMU measurements and the other provides ground truth, like position and orientation.
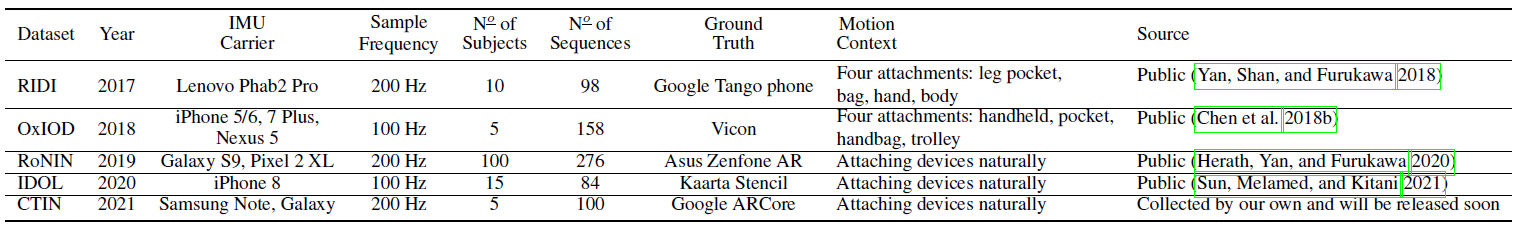
Table.1 - Description of public datasets used for evaluation of navigation models.
Table 2 shows experimental trajectory errors across entire test datasets. It demonstrates that CTIN can achieve the best results on most datasets in terms of ATE, T-RTE, and D-RTE metrics, except for two cases in RoNIN and RIDI datasets. R-TCN can get a smaller T-RTE number than CTIN in the RIDI-unseen test case; R-ResNet reports the smallest ATE of 3.99 for RoNIN-seen. In particular, CTIN improves an average ATE on all seen test datasets by 34.74%, 21.78%, and 37.46% over R-LSTM, R-ResNet, and R-TCN, respectively; the corresponding numbers for all unseen test datasets are 34.73%, 3.97%, and 29.47%.
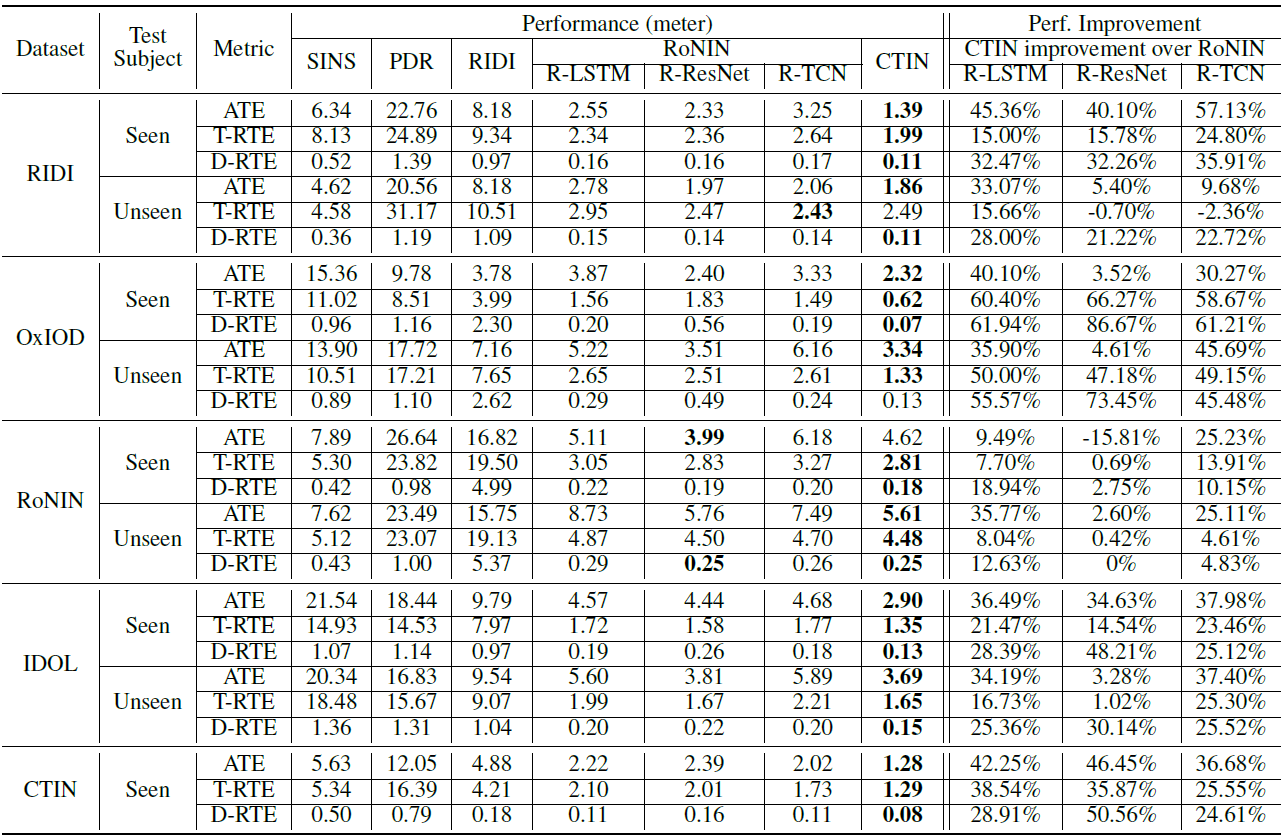
Table.2 - Overall Trajectory Prediction Accuracy. The best result is shown in bold front.
Two selected sequences visualization of reconstructed trajectories against the ground-truth for each dataset are shown from Figure 2 to Figure 5. We only show CTIN and three RoNIN variants methods. For each sequence, we mark it with sequence name and the trajectory length, also report both ATE, T-RTE D-RTE, and PDE of selected approaches. The trajectory with blue color is generated by the models and the orange one is built from ground truth data. Due to the uncertainty of predicted trajectories, there maybe have different shapes of ground truth trajectory for a sequence. For example in Figure 3, it looks like the shapes of ground truth trajectory for the sequence “handbag_data2_seq2 (Length: 494m)” are different because of different scales of axes. Actually, they are the same and use identical data to draw them.
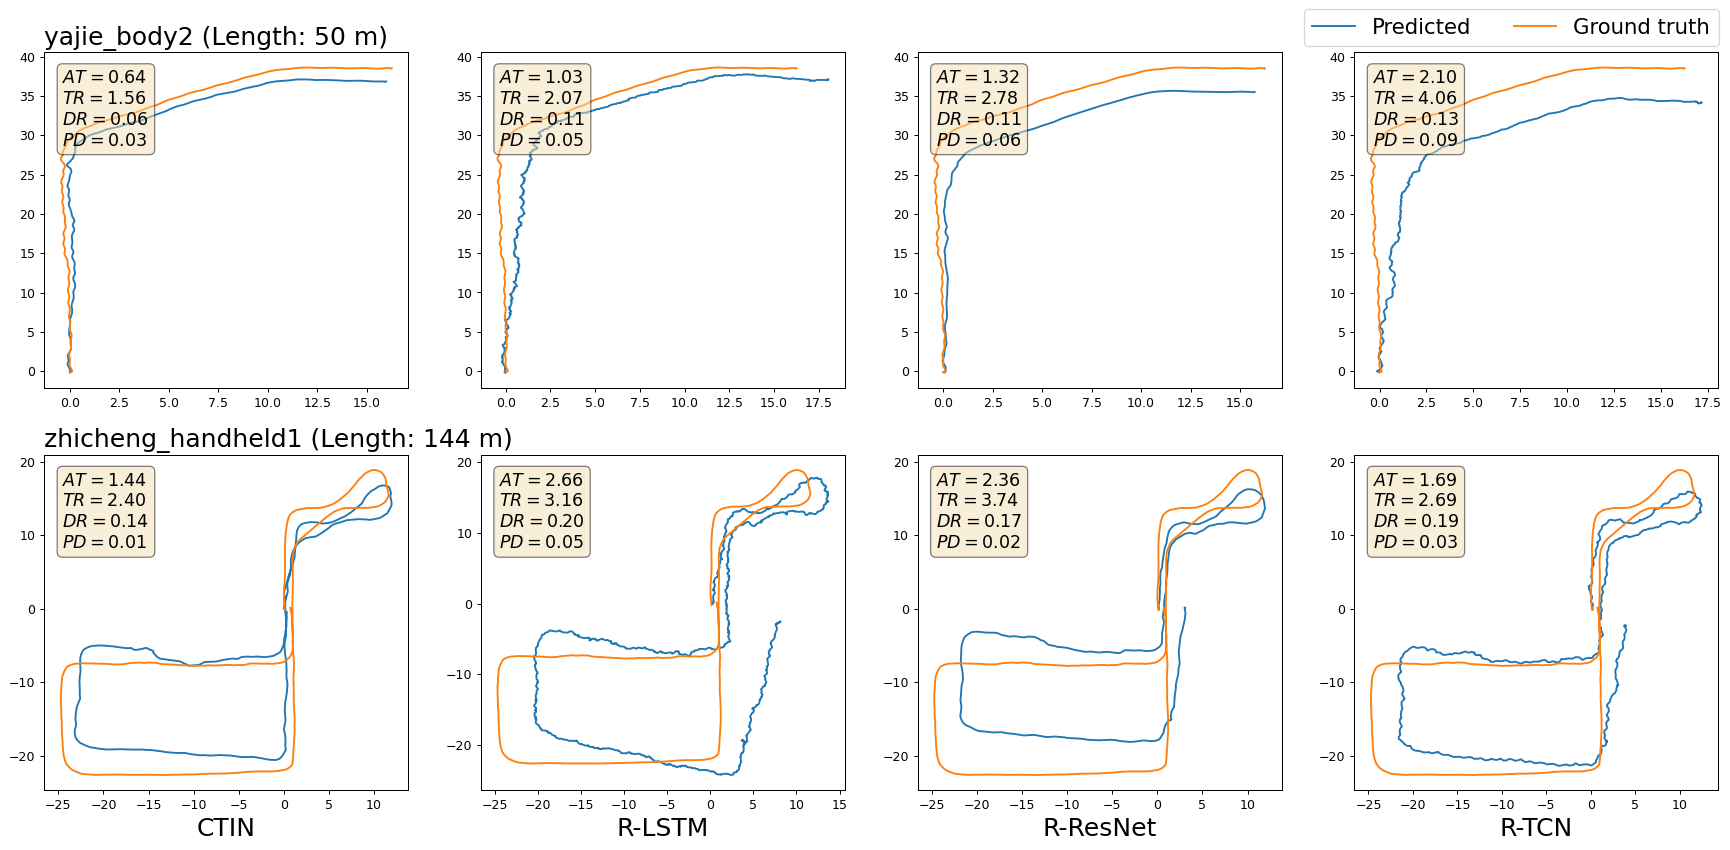
Figure.2 - Selected visualizations of trajectories from CTIN and RoNIN variants models on the RIDI dataset. Positional errors are marked within each figure, where “AT”, “TR”, “DR”, and “PD” denote metrics of ATE, T-RTE, D-RTE, and PDE, respectively.Sub-figures in a row show the visualizations of a selected sequence (named by the title of the first sub-figure) between theground truth trajectory and predicted ones generated by CTIN, R-LSTM, R-ResNet, and R-TCN, sequentially.
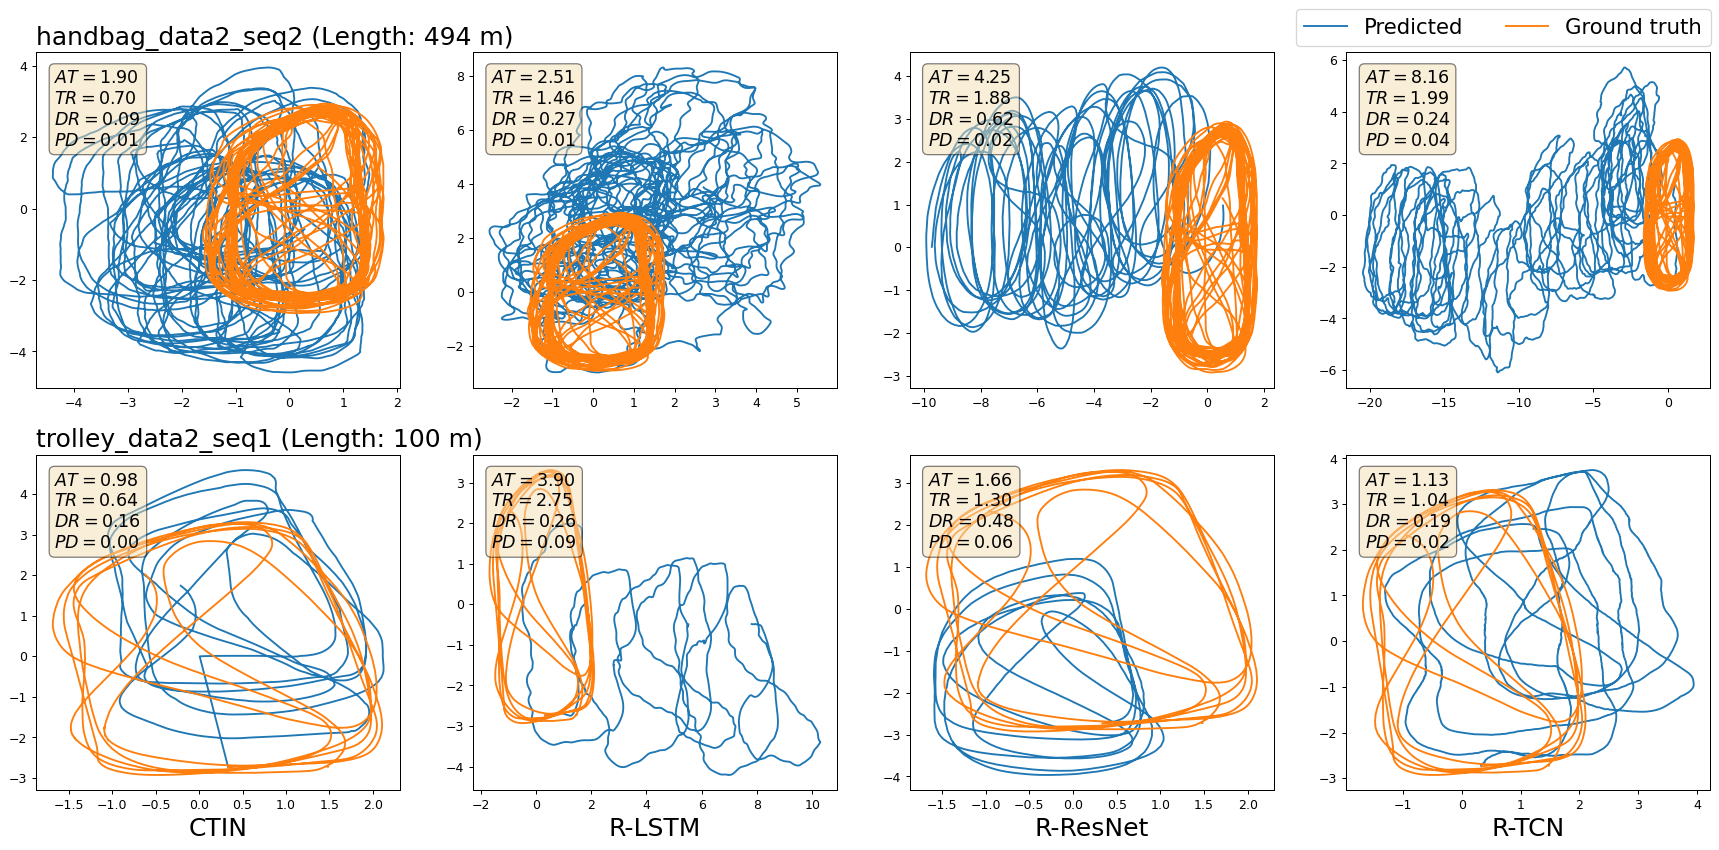
Figure.3 - Selected visualizations of trajectories from CTIN and RoNIN variants models on OxIOD dataset. Positional errors are marked within each figure, where “AT”, “TR”, “DR”, and “PD” denote metrics of ATE, T-RTE, D-RTE, and PDE, respectively. Sub-figures in a row show the visualizations of a selected sequence (named by the title of the first sub-figure) between the ground truth trajectory and predicted ones generated by CTIN, R-LSTM, R-ResNet, and R-TCN, sequentially.
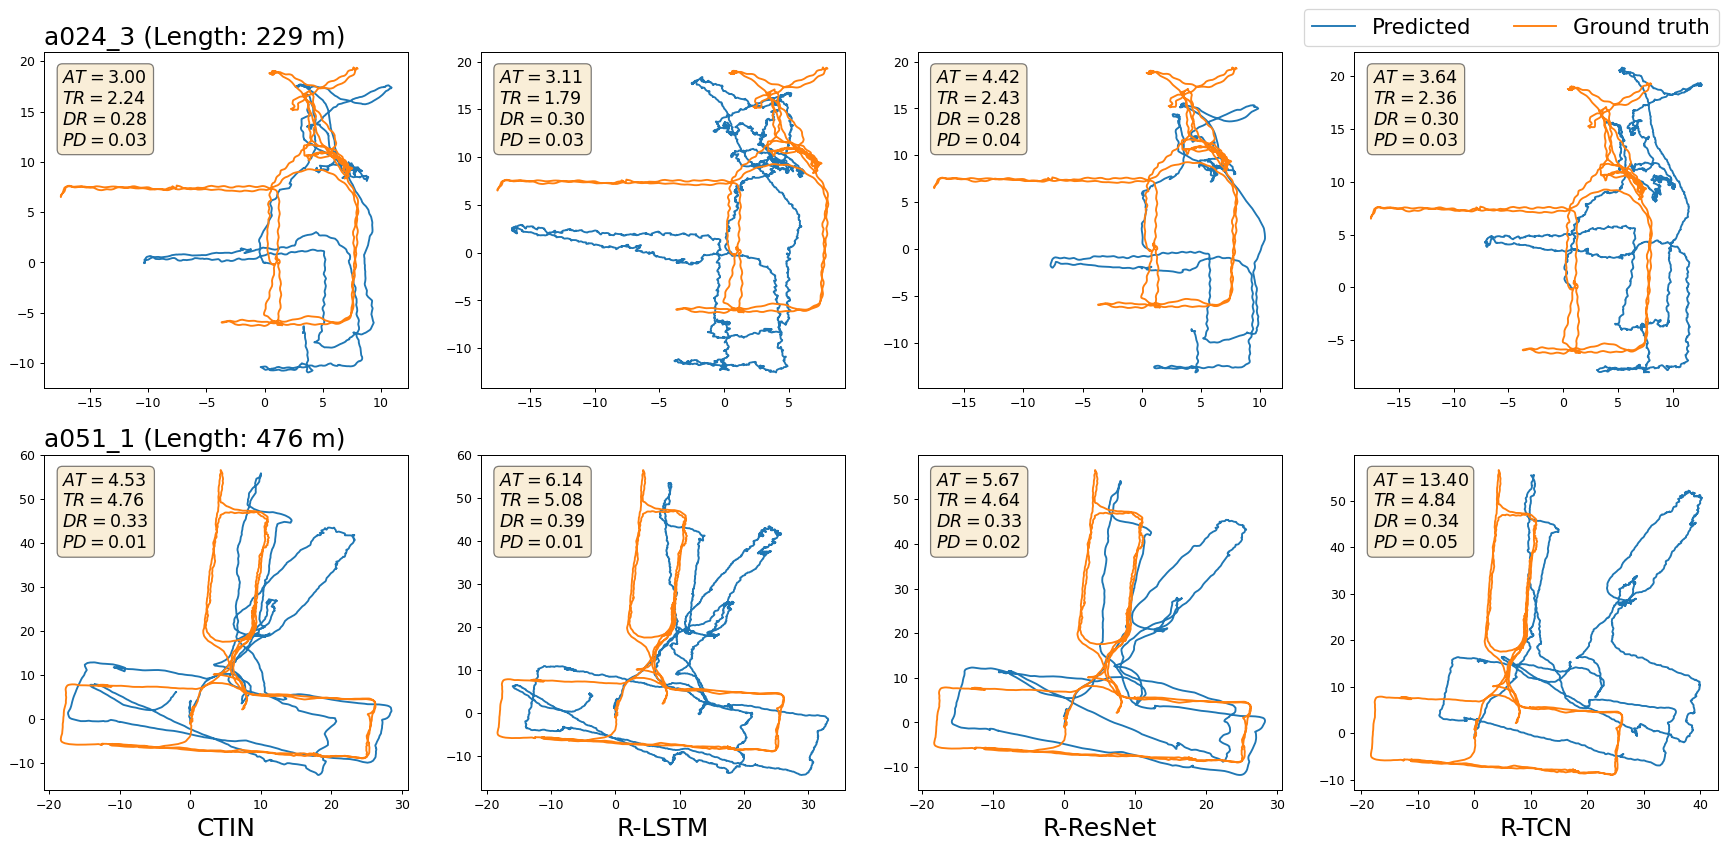
Figure.4 - Selected visualizations of trajectories from CTIN and RoNIN variants models on the RoNIN dataset. Positional errors are marked within each figure, where “AT”, “TR”, “DR”, and “PD” denote metrics of ATE, T-RTE, D-RTE, and PDE, respectively. Sub-figures in a row show the visualizations of a selected sequence (named by the title of the first sub-figure) between the ground truth trajectory and predicted ones generated by CTIN, R-LSTM, R-ResNet, and R-TCN, sequentially.
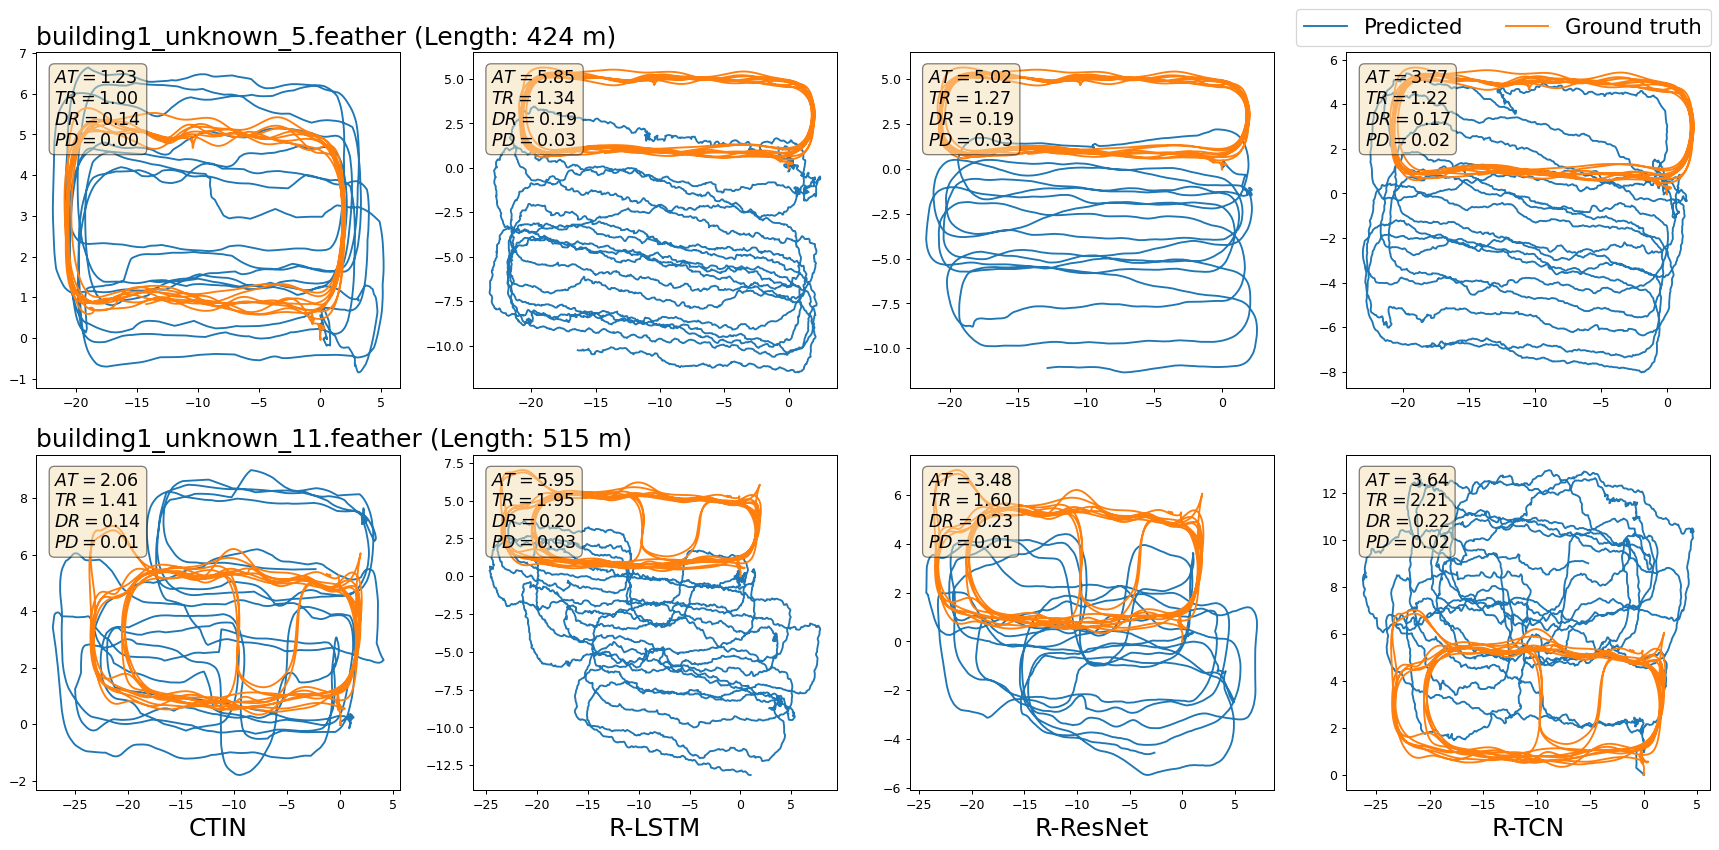
Figure.5 - Selected visualizations of trajectories from CTIN and RoNIN variants models on the IDOL dataset. Positional errors are marked within each figure, where “AT”, “TR”, “DR”, and “PD” denote metrics of ATE, T-RTE, D-RTE, and PDE, respectively. Sub-figures in a row show the visualizations of a selected sequence (named by the title of the first sub-figure) between the ground truth trajectory and predicted ones generated by CTIN, R-LSTM, R-ResNet, and R-TCN, sequentially.
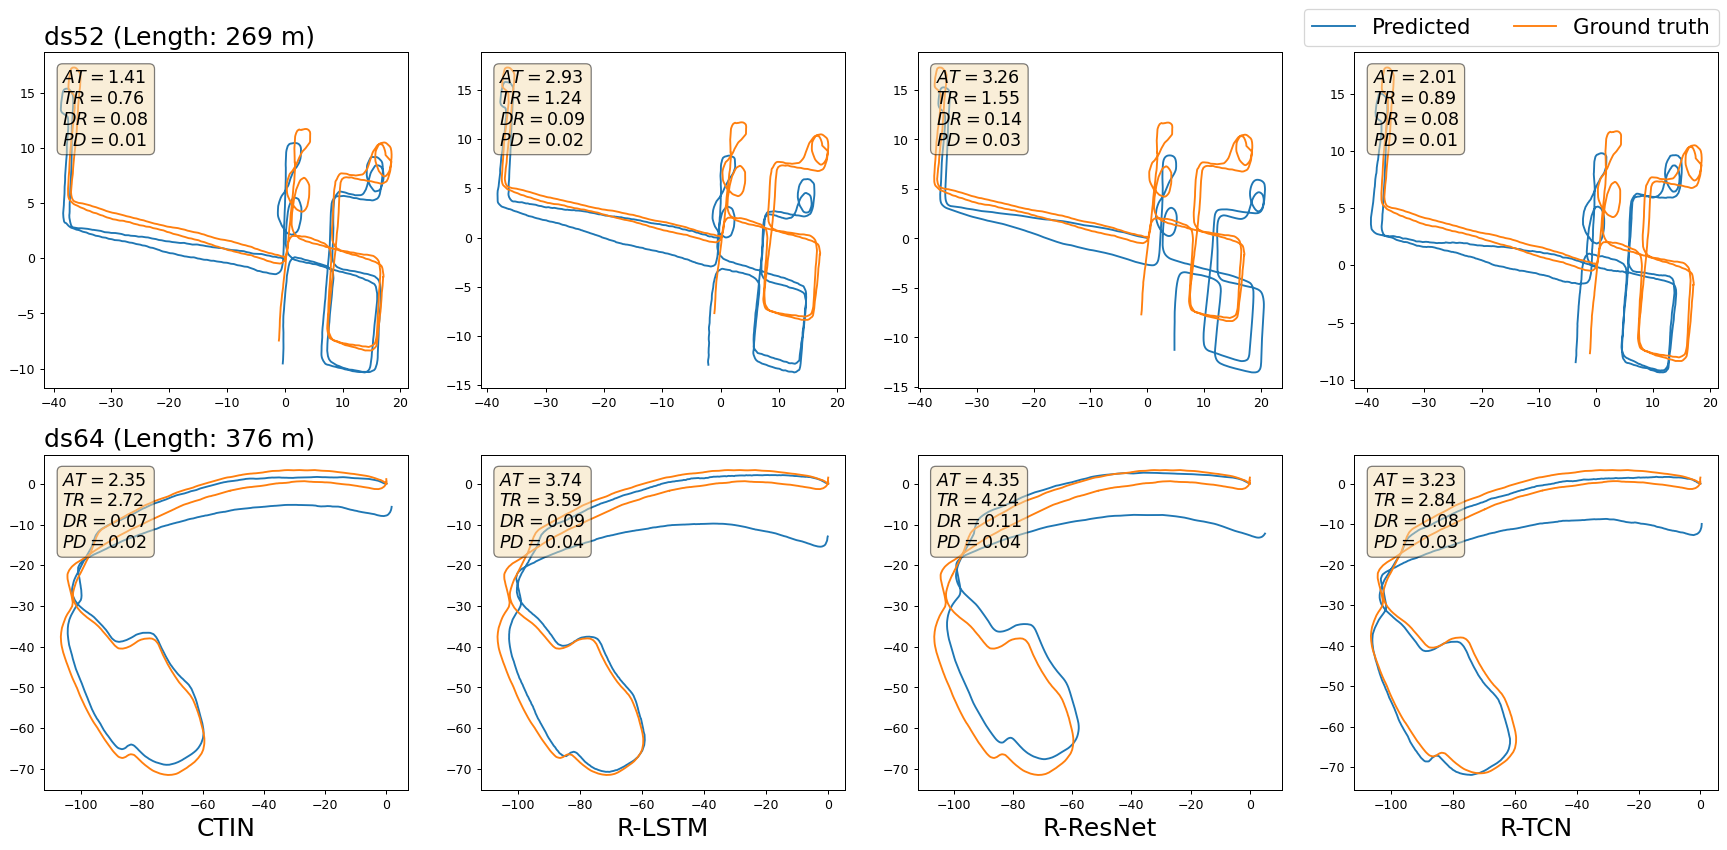
Figure.6 - Selected visualizations of trajectories from CTIN and RoNIN variants models on CTIN seen dataset. Positional errors are marked within each figure, where “AT”, “TR”, “DR”, and “PD” denote metrics of ATE, T-RTE, D-RTE, and PDE, respectively. Sub-figures in a row show the visualizations of a selected sequence (named by the title of the first sub-figure) between the ground truth trajectory and predicted ones generated by CTIN, R-LSTM, R-ResNet, and R-TCN, sequentially.
Tags:
Stats:
0 comments